📈 Power BI
Visualize your BIM data flexibly and securely with our free Power BI visual.
Unlock advanced BIM data visualization in Power BI with the Three BI visual. Build interactive dashboards, apply filters and create custom diagrams—while ensuring your data remains secure and under your control.
Key advantages of the Three BI visual for Power BI:
- Completely Free: No licensing fees or hidden costs.
- Data Privacy: At no point do we have access to your BIM model: from conversion in the web viewer to loading in your Power BI report, your data remains fully under your control.
- Fast Loading: Convert your IFC file to a 3D model once (see Getting Started, Step 2), then benefit from fast loading and smooth interaction in Power BI.
Demo
Installation
To get started, install the Three BI visual directly from the Microsoft AppSource Marketplace:
Getting Started
A Quick Heads-Up Before You Start
Setting up your own Power BI report from an IFC file takes a few steps - don’t worry, I’ll walk you through everything below. If you just want to see how the Three BI visual works without going through the whole process, you can try out the sample project straight from the AppSource Listing. That way, you can try things out right away and get a feel for what’s possible before diving in with your own data.
Convert Your BIM File to an Excel File
Power BI doesn’t support IFC files natively, so the first step is to export your BIM model as an Excel file. Here’s how I do it:
- Follow the Getting Started Guide.
- In the top-right menu, go to
File→Export→3rd Party Connectors→Power BI.
- Select the BIM model you want to export.
- Choose the properties you want in your Excel file.
- Example 1: Exporting
NameandOverallHeightfor all doors: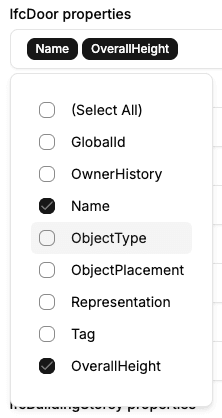
- Example 2: Exporting
Elevationvalues for all building storeys: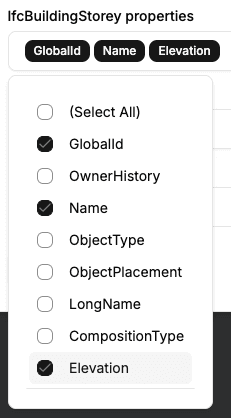
- Example 1: Exporting
- If you only want part of your model (like a single storey), use the Object Tree to hide elements and activate
Only export visible elements. Learn more. - Click Download to save your Excel file.
Load Your Data into Power BI
- Create a new Power BI report.
- Import the Excel file you just exported.
- Select the three tables:
ifcEntity,instancedMesh, andmeshInstancefrom the Excel file.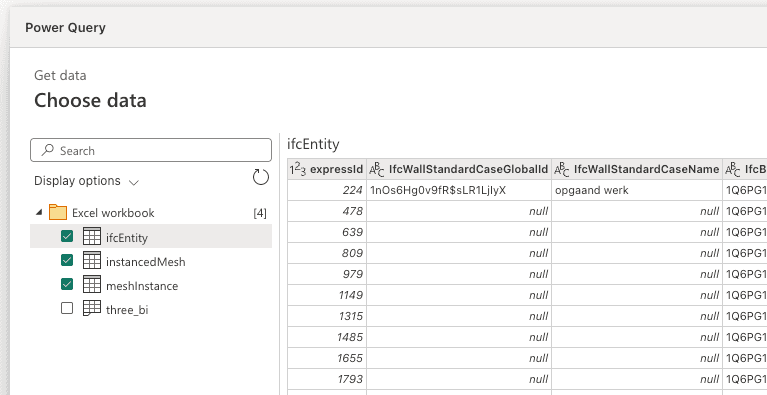
Now your BIM data is ready to be visualized!
Visualize Your BIM Data in Power BI
Check Table Relationships & Data Types
Make sure the three tables you imported have Relationships set up, and that the materialOpacity column in the instancedMesh table is set to the decimal number type. For more infos check the Troubleshooting Section.
- Add the Three BI visual to your report.
- Map your dataset fields to the visual. It’s important to map all geometry columns. Otherwise, the visualization might not work as expected.
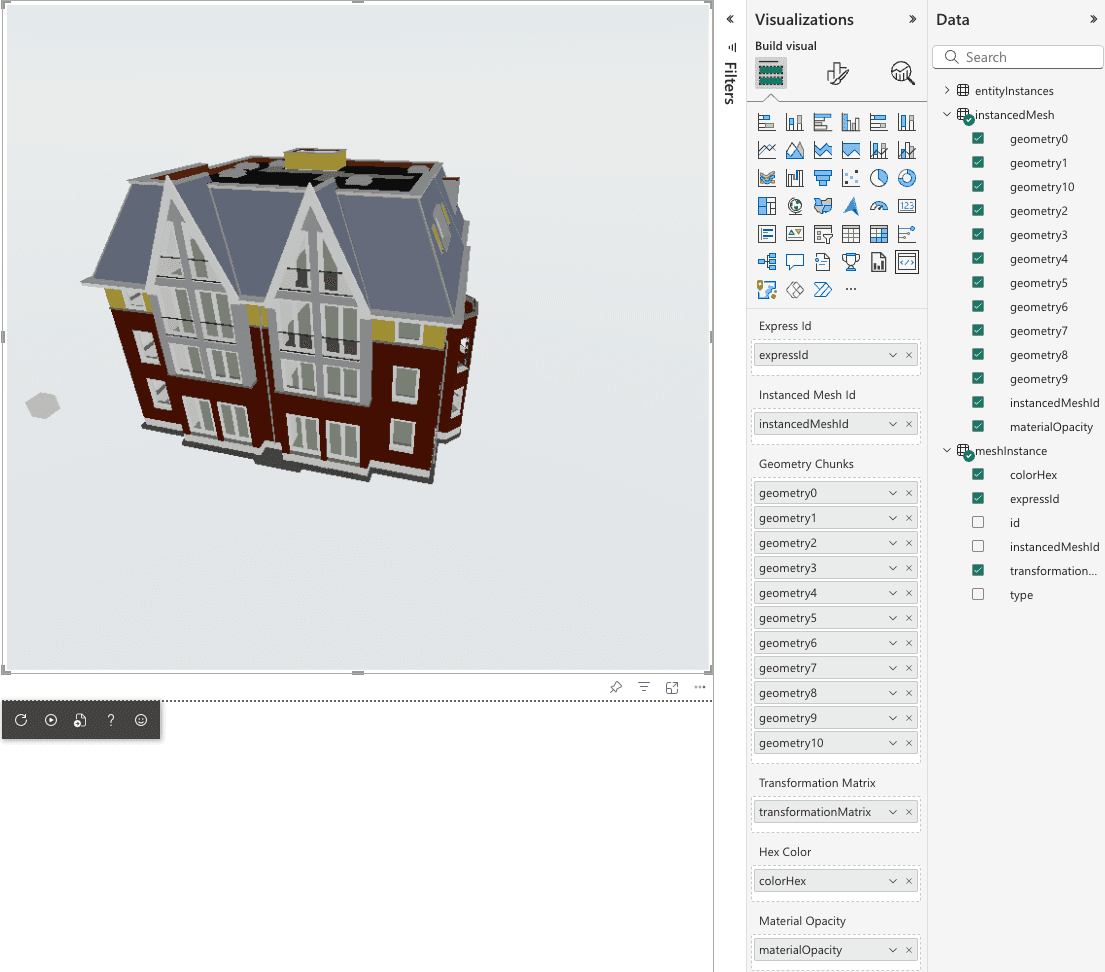
- Your BIM model should now appear inside Power BI, fully interactive!
Create Interactive Dashboards
You can combine the Three BI visual with standard Power BI charts to build interactive dashboards. For example:
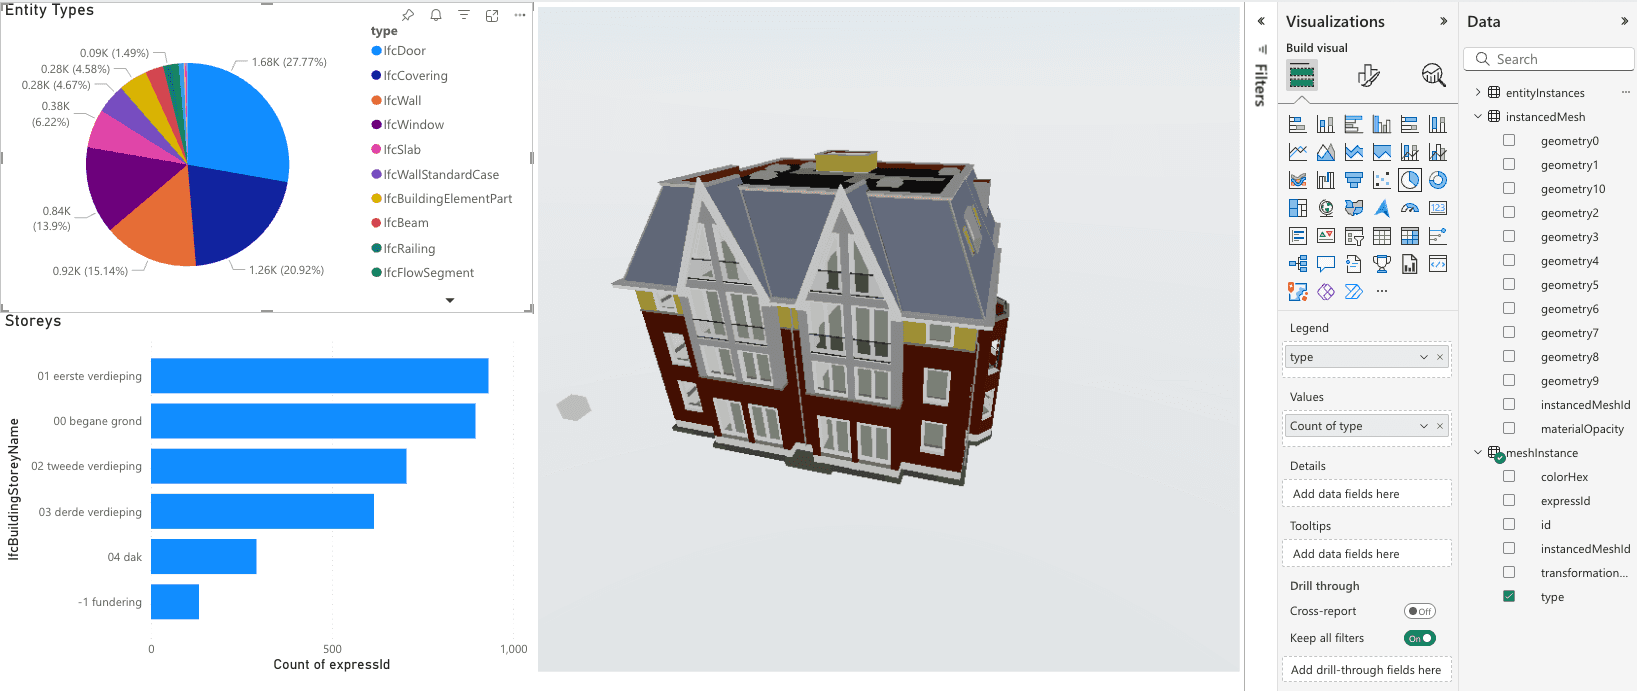
- Pie Chart Example:
- Bar Chart Example:
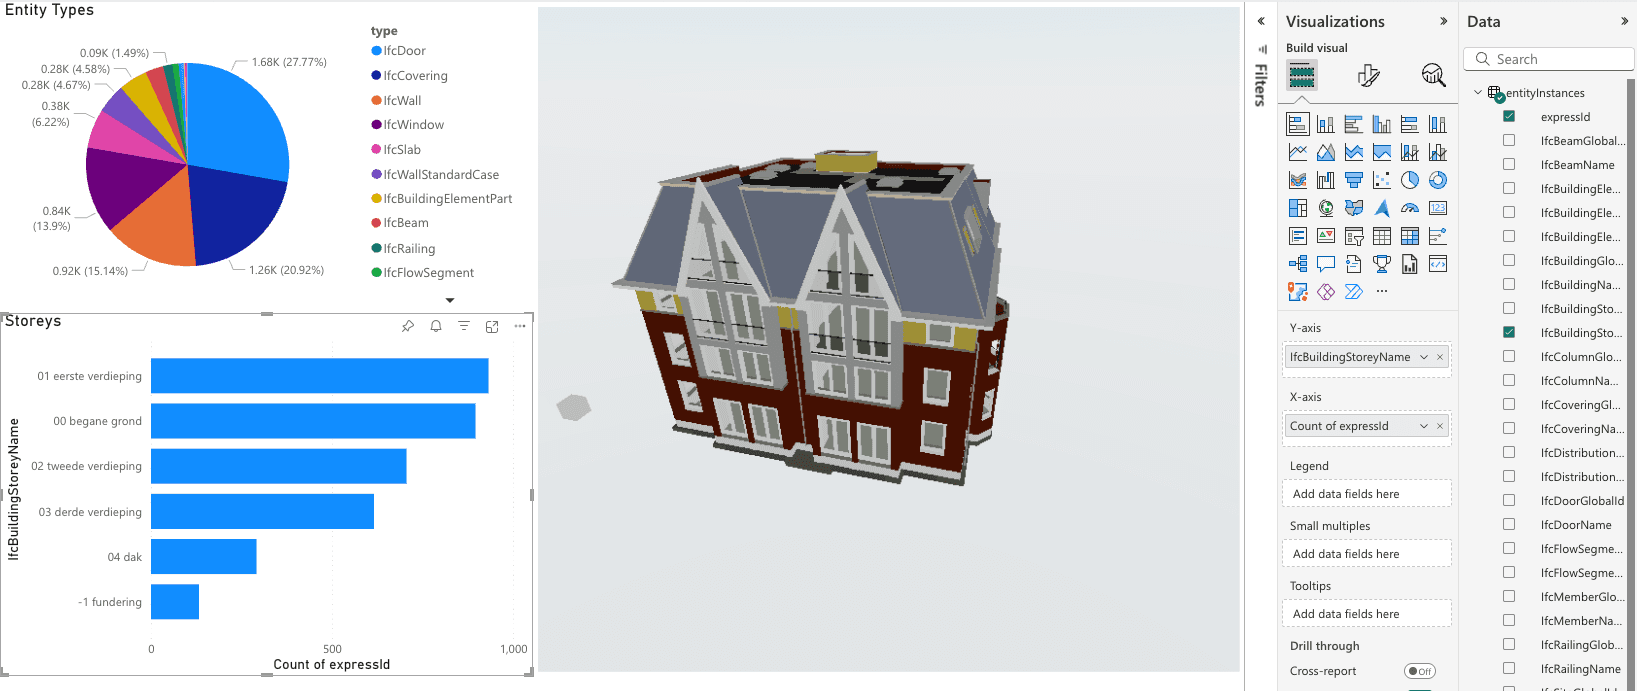
These charts can filter and interact with your BIM model, offering deeper insights and a more dynamic reporting experience.
Troubleshooting
Table Relationships missing
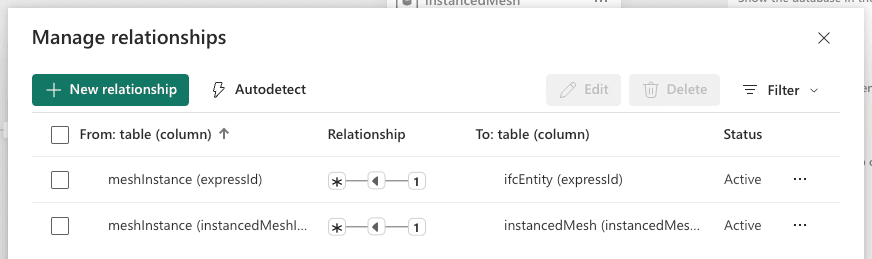
If your tables (ifcEntity, instancedMesh, and meshInstance) aren’t connected, you’ll need to set up Relationships in Power BI. Here’s what it should look like:
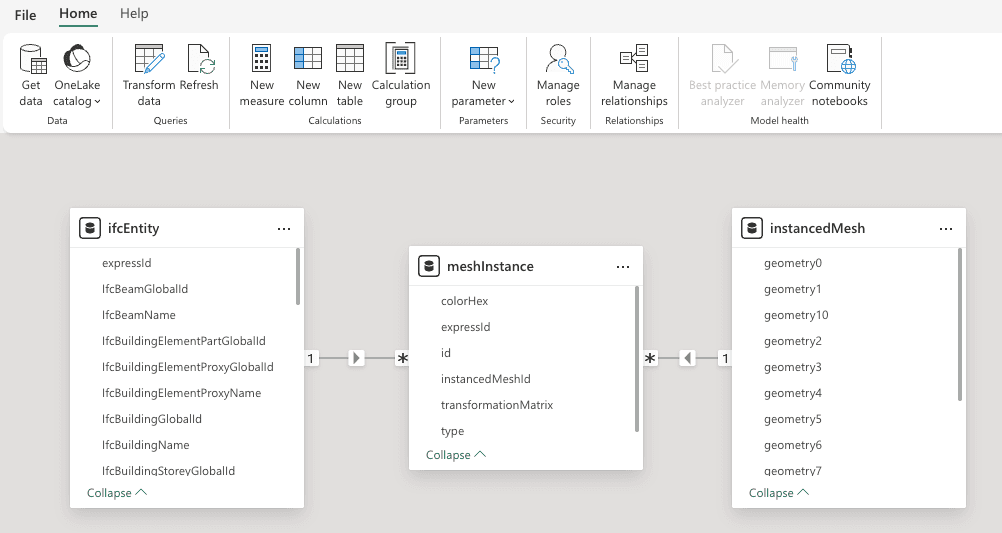
The relationships should connect the tables as shown below:
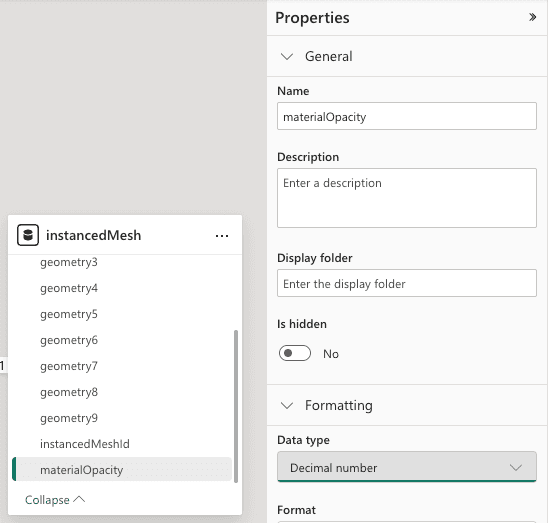
Wrong data type of materialOpacity column
Sometimes Power BI detects the materialOpacity column in the instancedMesh table as text. Make sure to set its data type to decimal number:
If you have any questions or run into issues, feel free to reach out at [email protected].